When a surprise to the upside isn't all it's cracked up to be.
Holiday Sale
Are you tired of seeing another stop loss hit or, worse yet, being liquidated
Most traders come into the markets thinking that just because they CAN trade they know HOW to trade. The truth is, nobody enters the market with any real understanding of how and why the market moves like it does. They rarely know what indicators and candlestick or price action patterns are, and certainly don’t know how to use all of that in a way that will work for them. Sadly, they rarely even put forth the effort that’s required to learn and correctly practice this new skill set. That’s why 80% of all day traders quit within the first two years, with 40% of them day trading for only one month.
But what if you had someone who could show you the ins and outs; someone that could save you a lot of time and money in the process? How much would it be worth to you if you could turn things around and actually become consistently profitable? What would it mean to you and your family? What kind of life would you be able to live?
We are currently running a HUGE sale on our LMT Mentor Program which will begin on December 28th. If you join during our holiday sale you will get 55% off the normal price! And we also offer a financing option that doesn’t check your credit, work history, or anything else. Click on the logo to be taken to the site.
We are also offering a Tier 3 holiday deal. Get 1 month of Tier 3 access for only $75! That’s $125 off the normal monthly price. And there is no commitment nor auto-renew, so you don’t have to worry about forgetting to cancel your subscription. *Holiday special is not stackable with any current access. Click on the logo to be taken to the site.
Jerome Powell’s Speech
Powell spoke earlier last week, sounding much more dovish than he has been up-til-now. He went so far as to say that the Fed may even slow down their pace of rate hikes, raising only 50 bps in December rather than the 75 bps/month since this summer, “The time for moderating the pace of rate increases may come as soon as the December meeting.” The concern, he mentioned, is that “uncertain lags” in the economy and inflation result from the Fed’s monetary policy. All that said, Powell also warned the terminal policy rate is likely to go higher, overall, than what the FOMC had previously thought so borrowing costs are expected to remain high for now. Employment is the big thing that the FOMC is watching.
The Jobs Report Release
What could push the Fed to raise rates another 75 bps in December? This past week’s NFP (Non-farm Payrolls Report) of course. With an estimated 200,000 job increase coming into the release, what we actually saw was an increase of 263,000. However, it’s important to keep in mind that the increase was still less than the previous month’s upwardly-revised 284,000 new jobs. Moreover, the jobs report has been in a downtrend since February 2022’s 714,000 increase, with the July increase of 537,000 being the outlier.
The other part of the NFP that got attention was that avg. hr earnings popped up 0.6% MoM, which was double the estimate at 0.3%. Additionally, the YoY avg. hr earnings clocked in at 5.1% while expectations were for 4.6%.
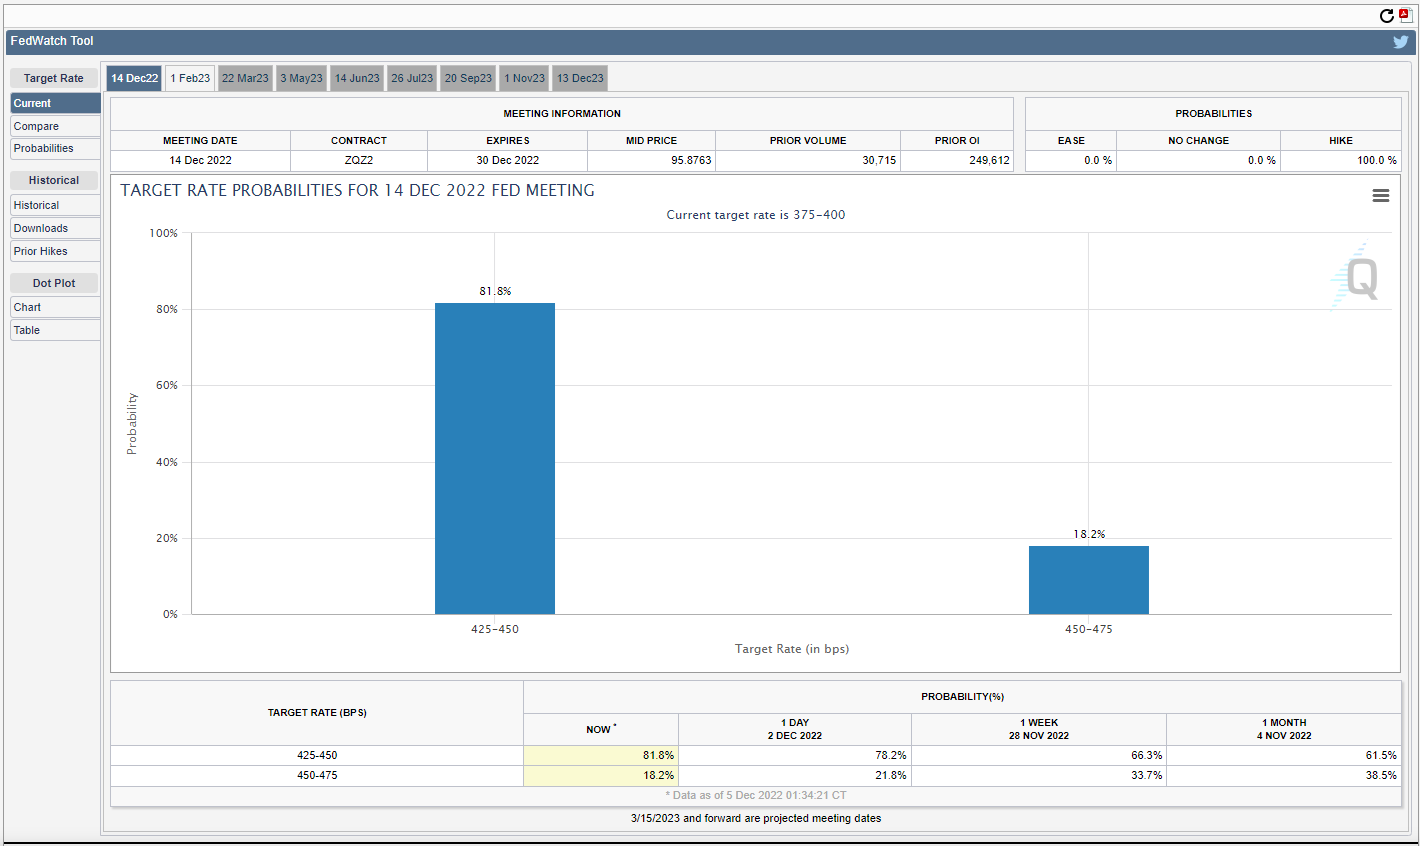
These two areas continue to plague the FOMC and, therefore, could give reason for one more 75 bps rate hike. The market, for what it’s worth, is currently pricing in an 81.8% chance of a 50 bps hike and 18.25% chance of a 75 bps hike. The dollar has continued to drop and stocks and Bitcoin have continued to rally.
The U.S. Dollar
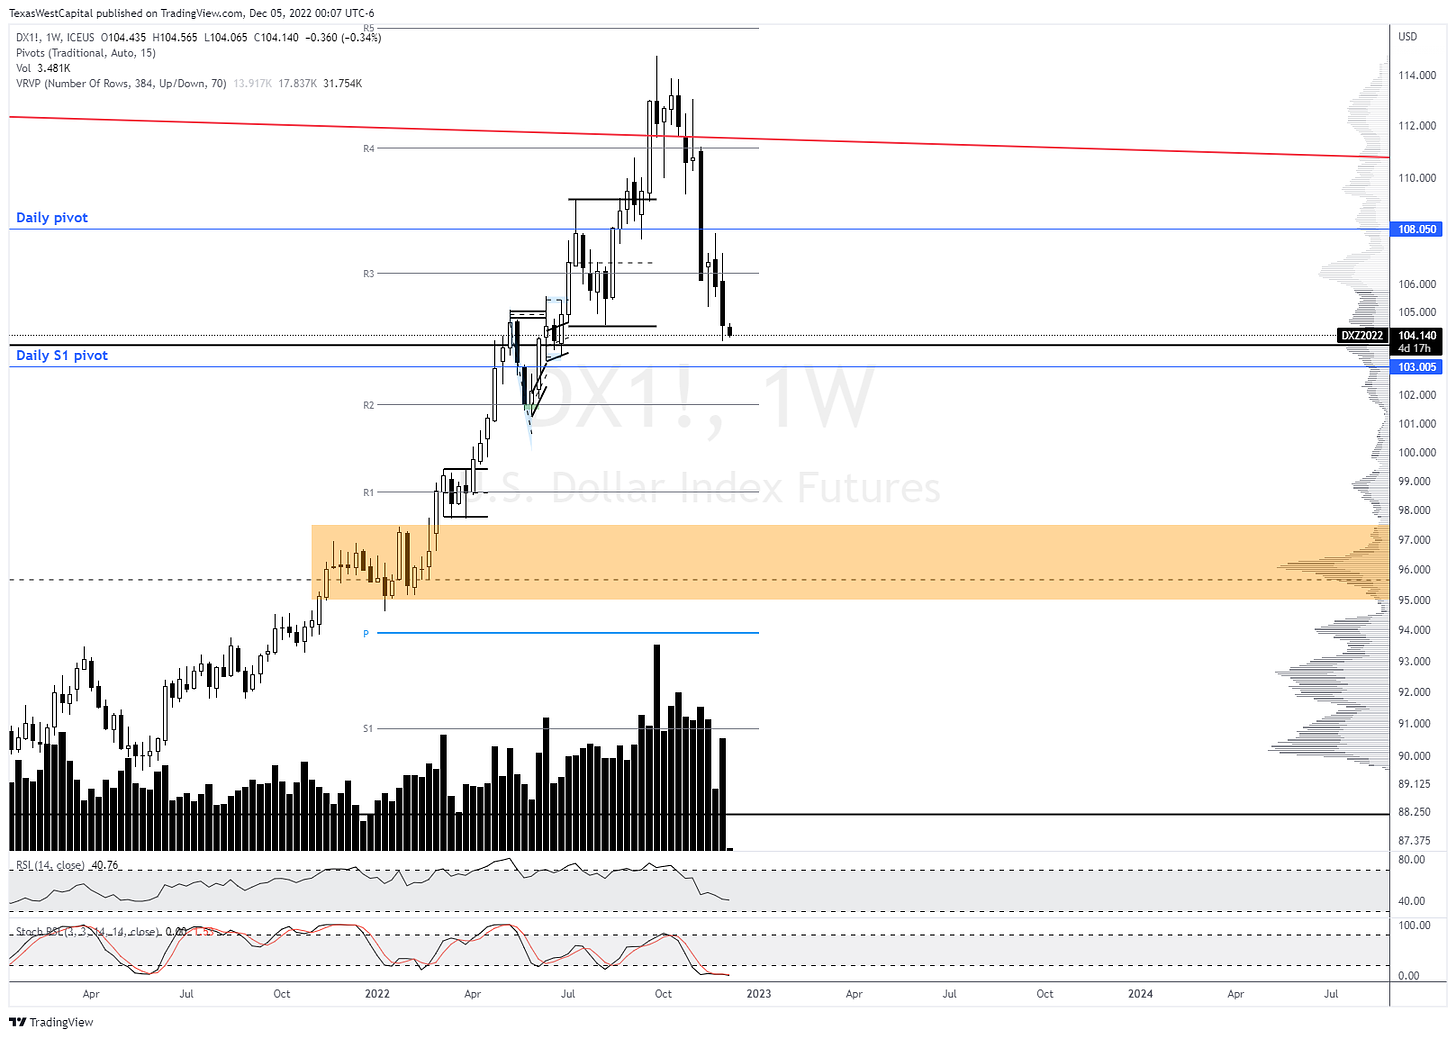
The dollar continued to slide and looks anemic at this point. We are likely to see it target the daily S1 pivot, at least, before catching a bid. However, a rally is expected to be rejected no higher than the daily pivot at ~108.050. The orange zone at 95.00-97.50 remains the target for now.
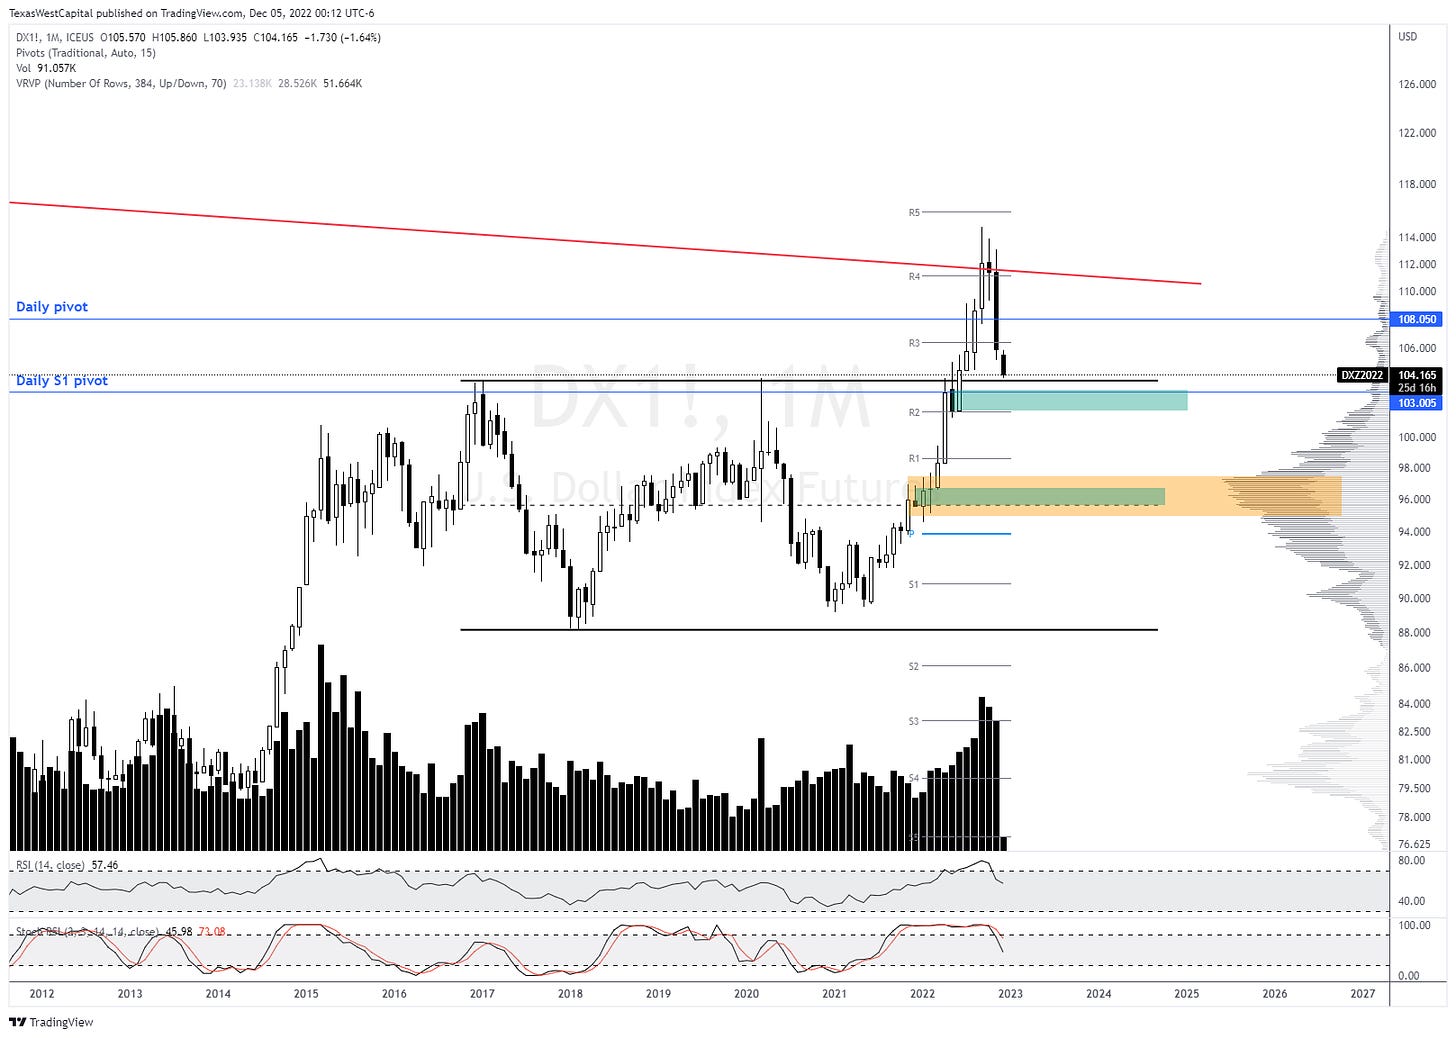
November’s monthly candle printed a large bearish candle with a spread of 5.525 points. The dollar suffered a ~5% loss last month. As we can see in this monthly chart, the daily S1 pivot is at the top of the green demand structure from May of this year. So, again, it looks most likely that the dollar will catch a bid there and bounce toward the daily pivot before being rejected and sent toward the orange zone. Specifically, my expectation is that the dollar will target the range EQ area around ~95.660-96.735.
The Dow Jones Index
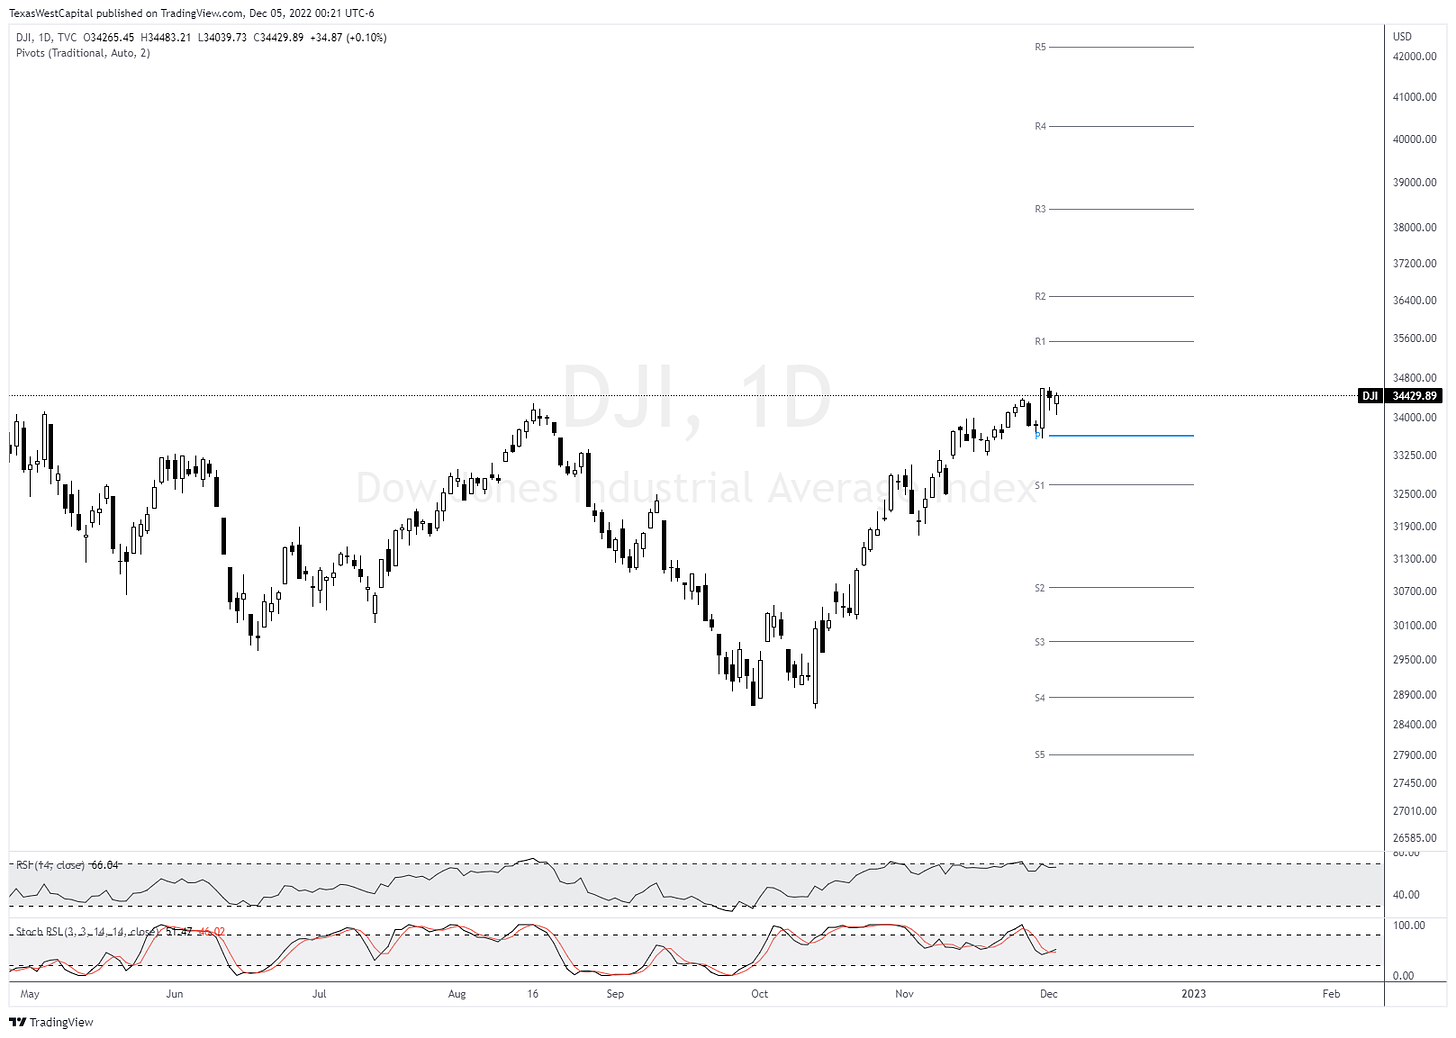
Last week I mentioned that I was looking for further pullback toward ~31400/31450, which was the daily pivot at that time. However, we saw the Dow dip just a bit lower before it caught a bid and rallied to breakout higher. With the new month comes new pivots and the Dow is now sitting between the daily pivot and daily R1 pivot. Friday’s close locked in a three-wave pullback so my expectation is for the Dow to rally higher with an initial target of the daily R1 pivot area at 35541. A rejection there will, then, give us an initial target of the daily pivot at 33646.
The S&P E-Minis
While the Dow’s structure makes a good narrative for an in-progress ATH, we need to see some confirmation with other stock indexes. The S&P futures chart shows that it is lagging the Dow. Breaking out above 4327.50 will get us above the same key area from mid-August that the Dow has already overcome. Like the Dow, the S&P E-Minis are also sitting between the new month’s daily pivot and daily R1 pivot.
The structure off the ATH appears to be a descending broadening wedge, which is a corrective pattern. Note that the E-Minis were rejected last week at that wedge’s resistance. An impulsive breakout above that resistance is likely to lead to a breakout above the 4327.50 key level, confirming the Dow’s breakout and setting up a likely new ATH. Locally, pulling back will have an initial target of the daily pivot and secondary target of the daily S1 pivot if price breaks down.
The NASDAQ 100
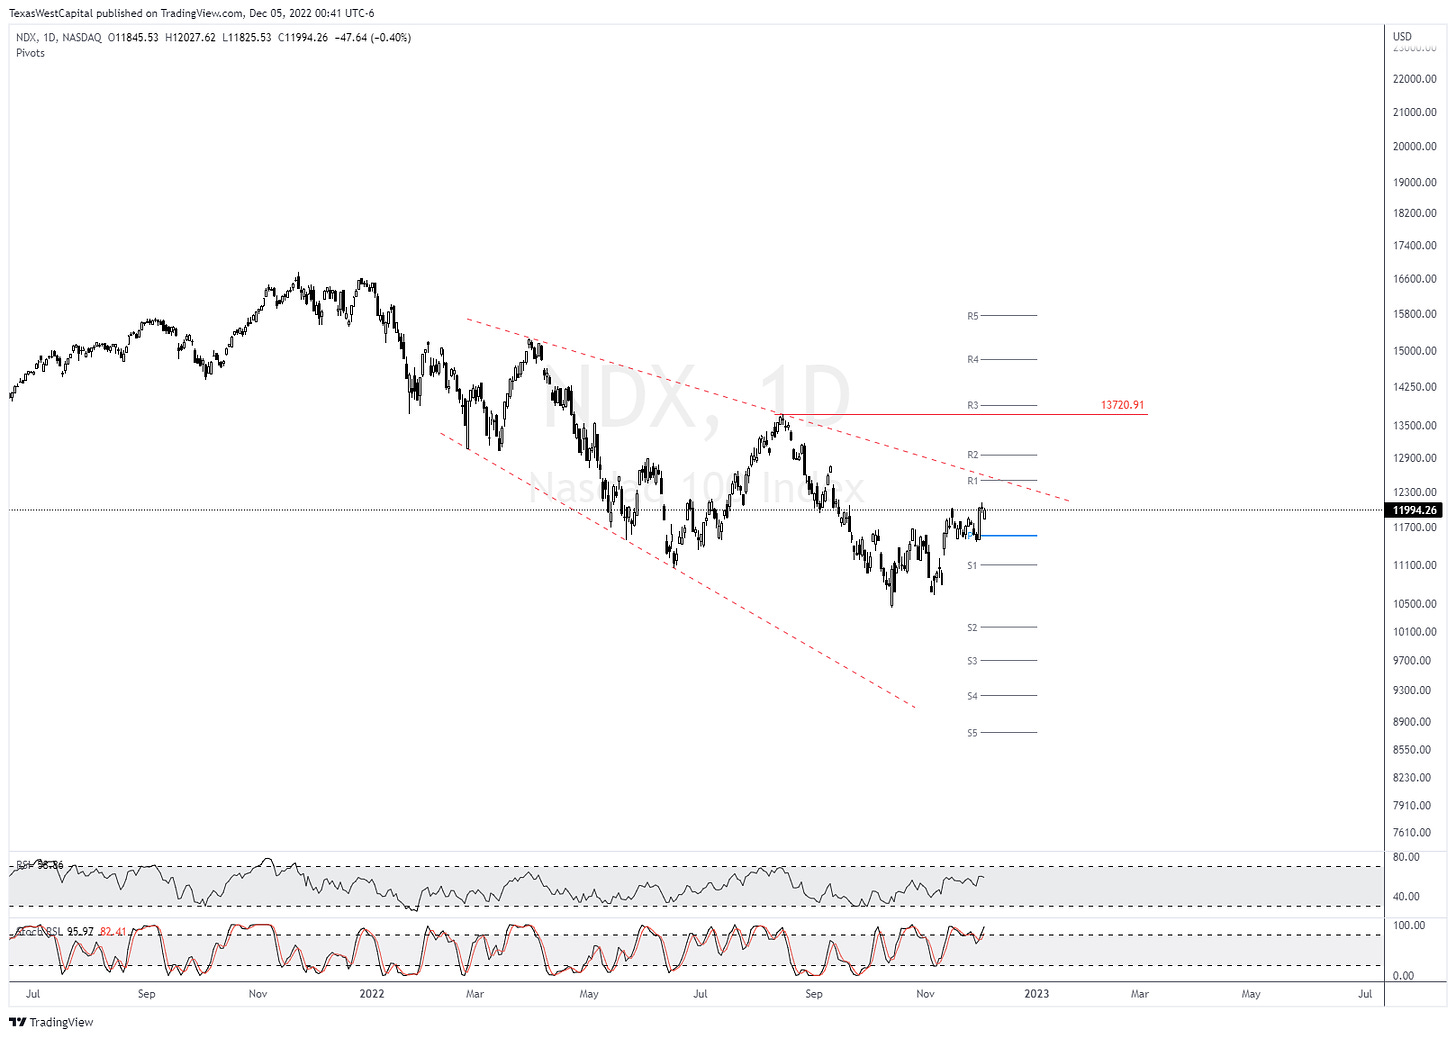
You’re going to notice a similarity in structure between the NASDAQ and the S&P and the Dow - the descending broadening wedge. You will also notice that the NASDAQ is further behind than the S&P in confirming the Dow’s breakout. The corresponding key level, here, is 13720.91. As with the Dow, breaking out above this mid-August swing high will significantly increase the odds that we are going to see a new ATH incoming. Prior to that, breaking out impulsively above the wedge’s resistance will likely signal that we will see a breakout above that key level. As with the S&P, breaking out above the mid-August swing high will confirm the Dow’s breakout. I am looking for the daily pivot to provide support for a reversal, but breaking down below it should see that reversal happen around the daily S1 pivot area.
Failure of the daily S1 pivot to hold as support on any of the three indexes is going to suggest that further downside is coming, rather than a new ATH. And, if so, then we should expect a very strong move to the downside.
Bitcoin
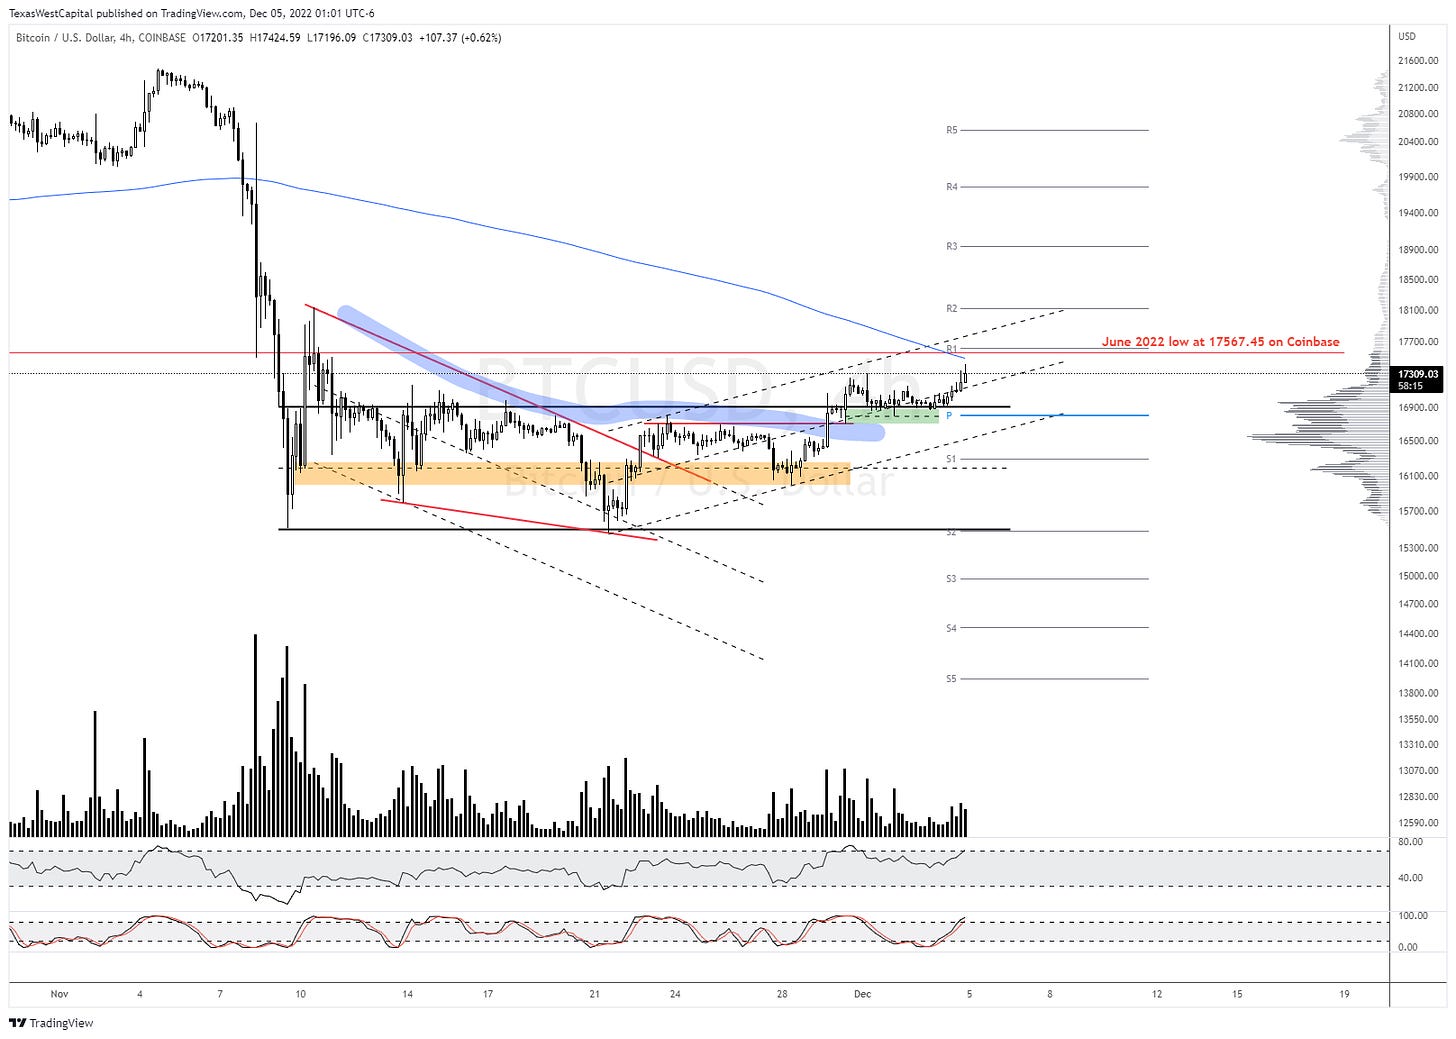
Price rallied to around $1000 higher, or ~5%, since last week’s newsletter. Looking at this H4 chart, we can see the impulsive breakout above the blue supply line. This carried price beyond the range resistance, which it pulled back to test before breaking out above the swing high today. Price was rejected just shy of the descending blue 200 period MA and June 2022 capitulation low at 17567.45. We can note that price is between the H4 pivot and R1 pivot, within the ascending dashed channel’s upper half. An impulsive breakout higher, above the confluence of resistance around the H4 R1 pivot will probably see price rallying another $1000 higher. This would prove to be very aggressive price action and signal a likely run of the pivots all the way through the H4’s R5 pivot at ~20568.
The following daily chart shows the anticipated path if that does occur. Notice that the ~20568 level has confluence with the daily R1 pivot. The two large down candles on November 8th and 9th provide ease of movement higher as the market showed little interested in that range other than the area around this month’s daily pivot.
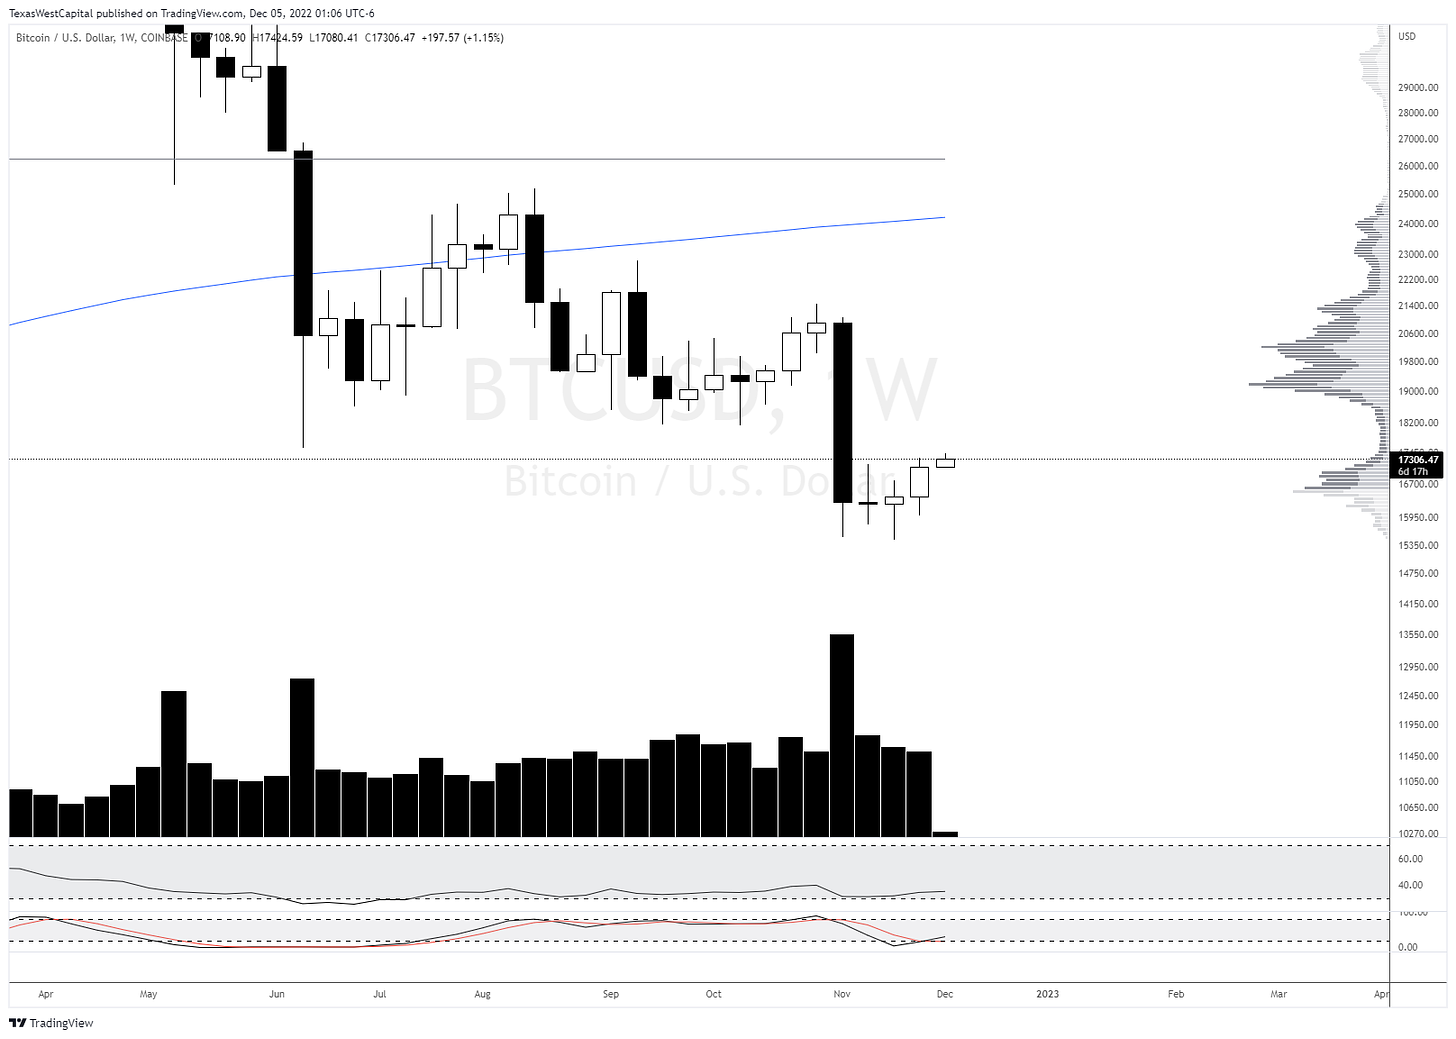
The weekly structure looks pretty solid off the lows - doji candles followed by an increasingly-larger candle. This shows us that it is taking less and less effort to get a better result (less volume but larger candle-spread in the candle over the past three weeks).
Final Thoughts
The dovishness of Powell earlier in the week overshadowed the jobs report’s surprise to the upside. After a knee jerk reaction at the NFP’s release, risk assets faded that pullback and closed the week near the previous day’s close. The futures and crypto market are continuing to rally at this week’s open in defiance of Friday’s jobs report. Will this last through the week? The reality of markets is that they don’t continue straight up, so if the rally continues then pullbacks along the way should be expected. Until something actually breaks down in the risk assets, I see little reason not to continue looking higher for now. The dollar doesn’t look good at all and would have a lot of ground to cover to signal that it is even beginning to look bullish. That doesn’t mean it can’t do so, just that it looks like a pretty steep road at this time. As always, if things happen that change how the charts look overall I’ll be sure to update you.
My Streaming Schedule
I stream simultaneously on YouTube.com/texaswestcapital, Twitch.tv/texaswestcapital, and Twitter.com/txwestcapital on Tuesdays and Fridays at 11:00 a.m. CST. I’d love for you to stop in and share your thoughts about the charts. We usually look at everything from Bitcoin to stock indexes, Forex to precious metals, oil and gas to individual stocks and crypto pairs as well as the DXY. And of course I do my best to explain the macro events and what they likely mean, which is often much different than the usual large social media influencer accounts.


